728x90
728x90
산점도 그리는것에 대해 공부한것을 기록하려고 합니다.
ggplot(data=iris, aes(x=Sepal.Length, y=Sepal.Width,color=Species))+
geom_point(shape=17, size=3)+
ggtitle("Scatter Sepal_Length,Width")+
geom_text(aes(label=Species, size=2, vjust=-1, hjust=0))
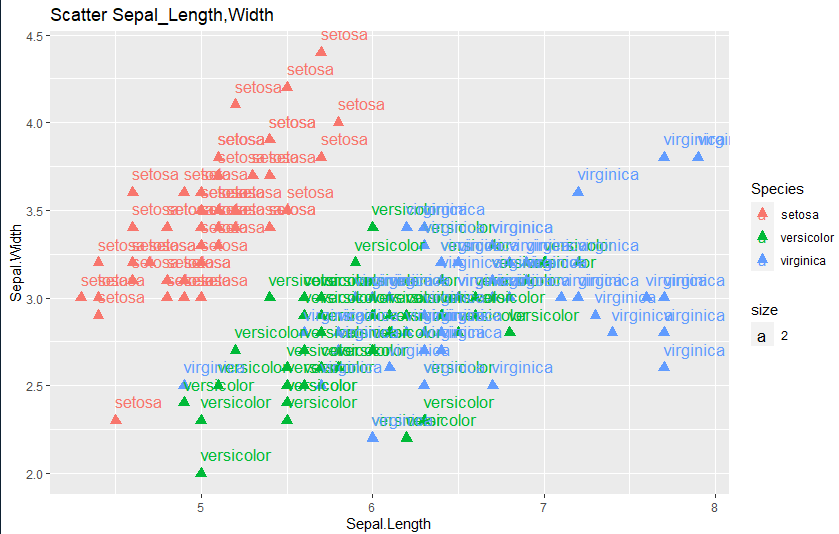
위와 같이 코드를 작성하면 Species별로 색을 나눠 입힐 수 있습니다.
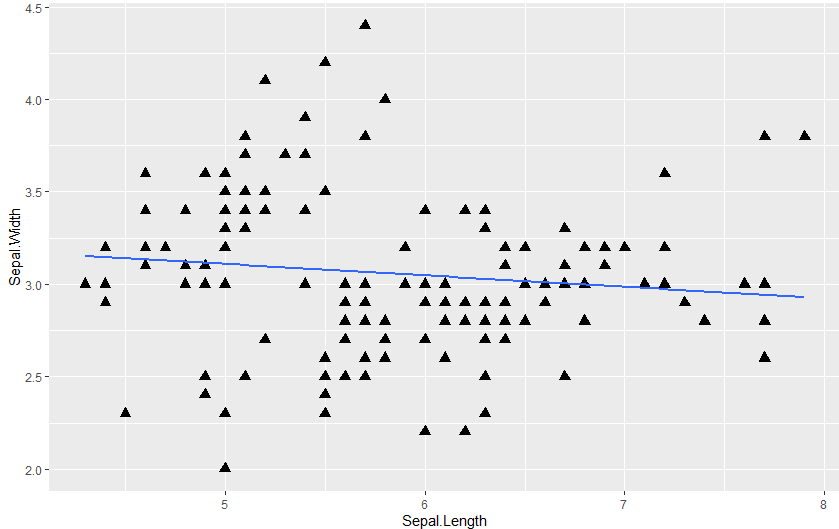
또한 scatter plot에 있는 point의 모양도 바꿀 수 있습니다.
모양은 아래와 같이 정할 수 있습니다.
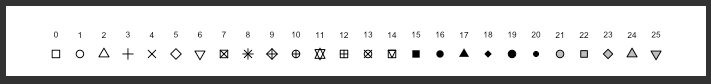
ggplot(data=iris, aes(x=Sepal.Length, y=Sepal.Width,shape=Species,color=Species))+
geom_point( size=3)+
ggtitle("Scatter Sepal_Length,Width")+
geom_text(aes(label=Species, size=2, vjust=-1, hjust=0))
Species별로 shape를 다르게 할 수도 있습니다.
ggplot(data=iris, aes(x=Sepal.Length, y=Sepal.Width)) +
geom_point(size=3, shape=17) +
facet_grid(Species ~.) +
ggtitle("facet_grid를 사용")
facet_grid를 이용해 Species별로 plot을 그릴 수도 있습니다.

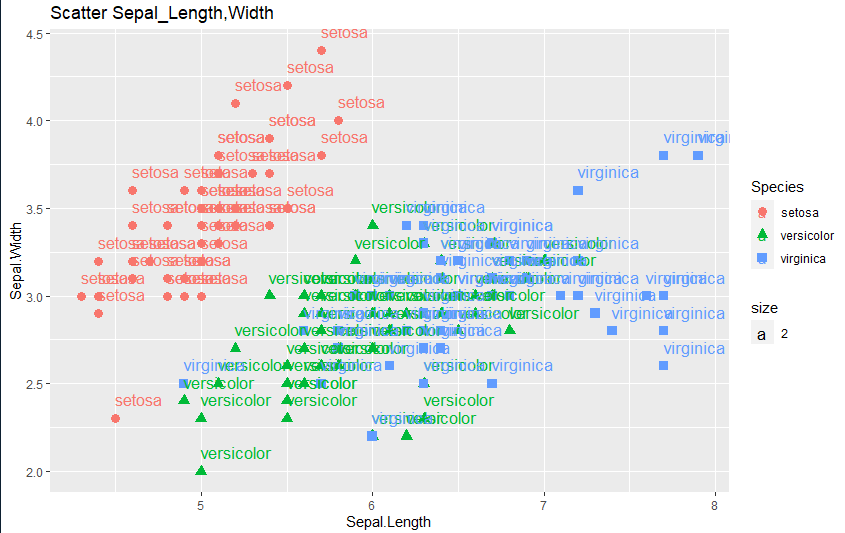
ggplot(data=iris, aes(x=Sepal.Length, y=Sepal.Width)) +
geom_point(shape=17, size=3) +
stat_smooth(method=lm,se=F)
선형 회귀선도 추가할 수 있습니다
728x90
728x90
'R' 카테고리의 다른 글
| R ) assign, get함수 알아보기 문자열을 객체로 사용하고 불러오기 in r (0) | 2022.08.19 |
|---|---|
| R ) 독학 :: 변수간 상관성 알아보기 cor.test() in r (0) | 2022.06.03 |
| R ) 독학 :: data 시각화 ggplot2 히스토그램 (histogram), 박스 플랏(boxplot) in r -2 플랏 겹치기 플랏 옵션 multi plot, plot option (0) | 2022.05.05 |
| R ) 독학 :: Randomforest 반복 수행 하여 plot으로 최적 model 찾기 in r (1) | 2022.05.05 |
| R ) ::독학 dataset 나누기 7:3, 6:2:2 in r (0) | 2022.05.03 |


댓글