728x90
728x90
안녕하세요 오늘은 ironpython을 이용해 시각화의 종류를 변경하는 것을 구현해보려 합니다.
data는 iris를 사용할겁니다
bar chart -> scatter chart로 변경하고 다시 반대로 변경해보는 것을 해보겠습니다.
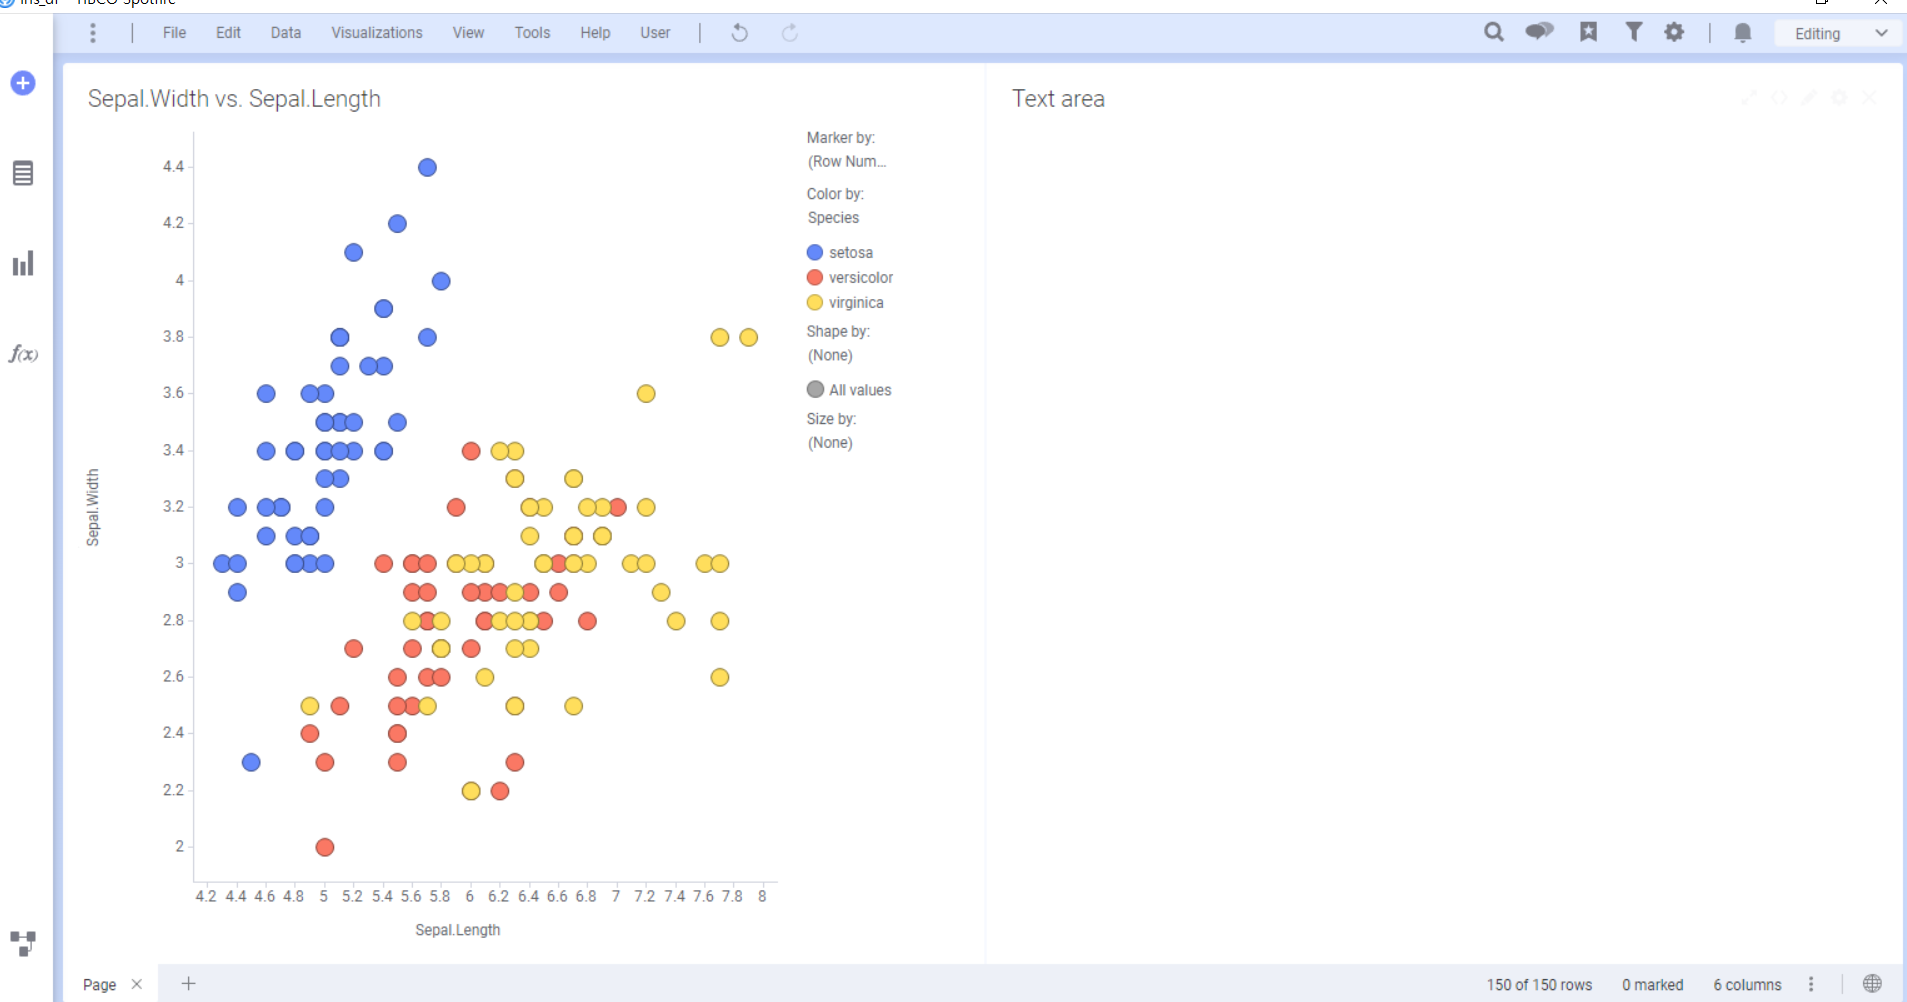
scatter chart와 text area를 만들어줍니다.
text area에 button을 만들고 button을 누르면 chart가 변경되도록 할겁니다.
이제 버튼을 만듭니다.
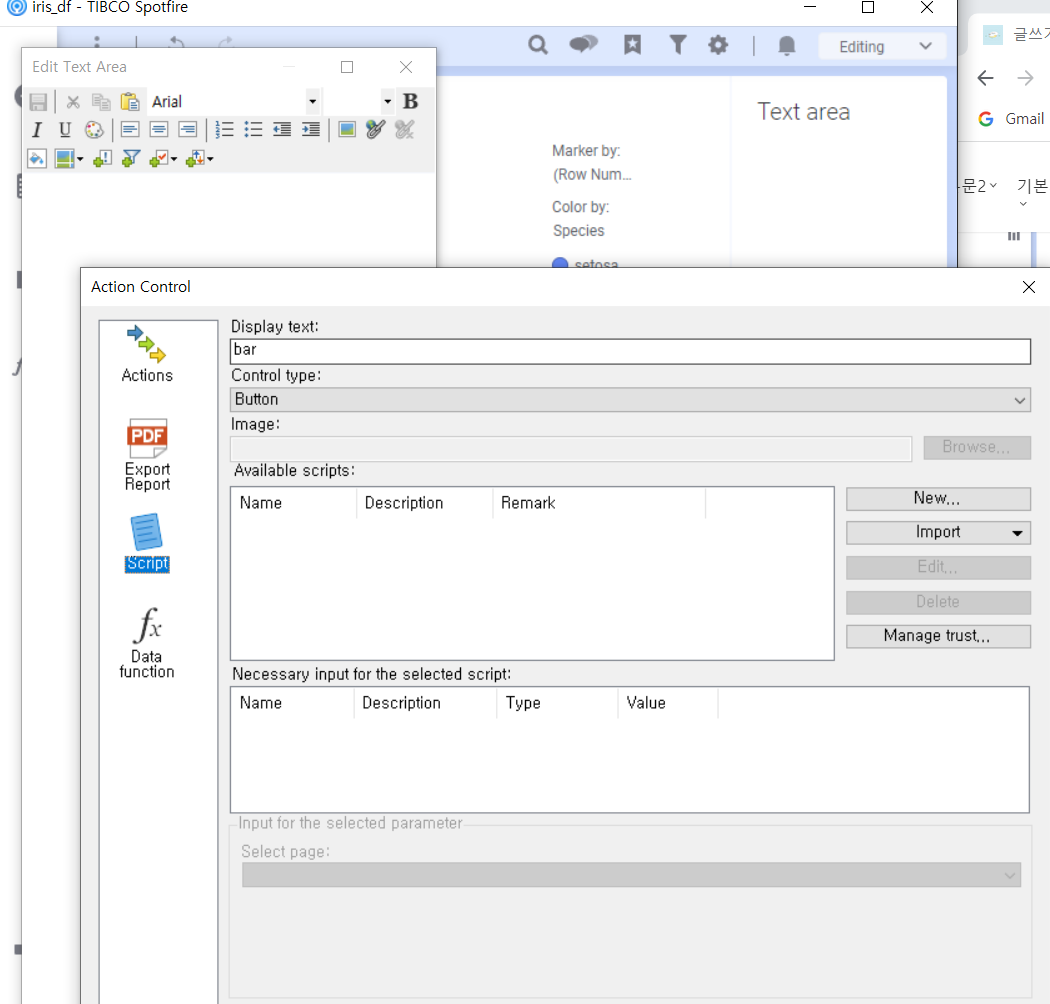
text area에서 edit text area - insert action control로 들어가 줍니다.
displat name을 bar로 하고 script로 갑니다
new를 누르고 아래의 코드를 입력합니다.
from Spotfire.Dxp.Application.Visuals import *
vis.TypeId=VisualTypeIdentifiers.BarChart
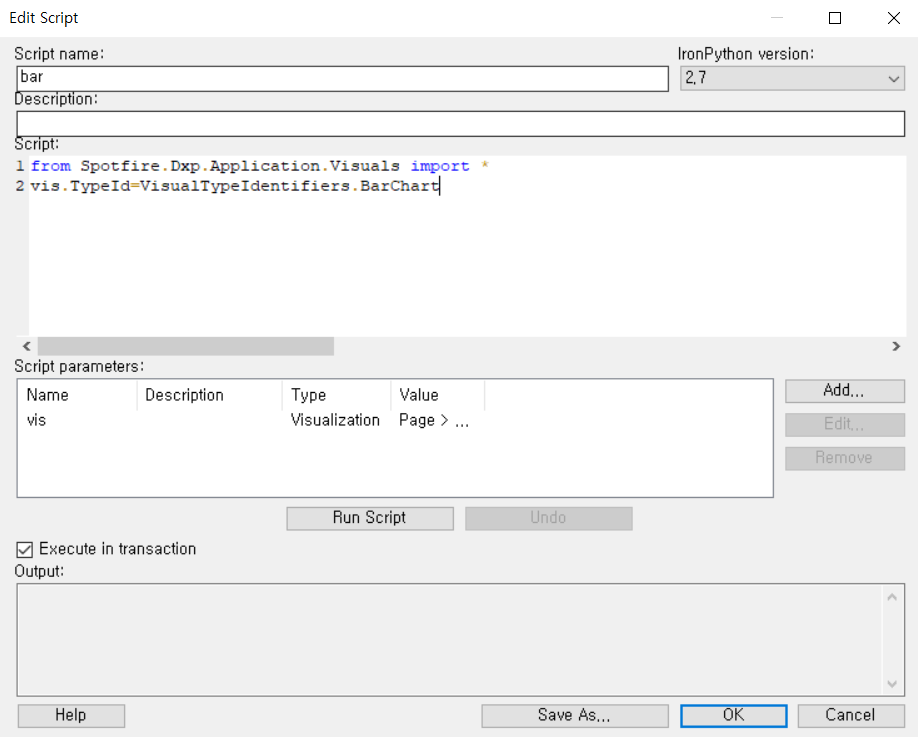
그리고 run을 하면
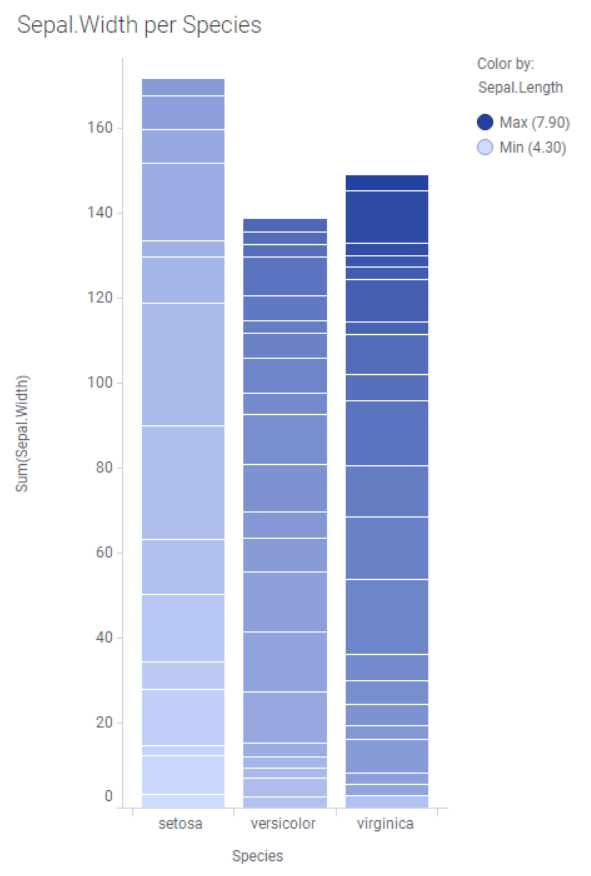
이렇게 bar chart로 변하는 것을 볼 수 있습니다.
이제 scatter로 바꿔보겠습니다 button을 만들어주는것 까지 같고 코드만 조금 바뀌주면 됩니다.
from Spotfire.Dxp.Application.Visuals import *
vis.TypeId=VisualTypeIdentifiers.ScatterPlot
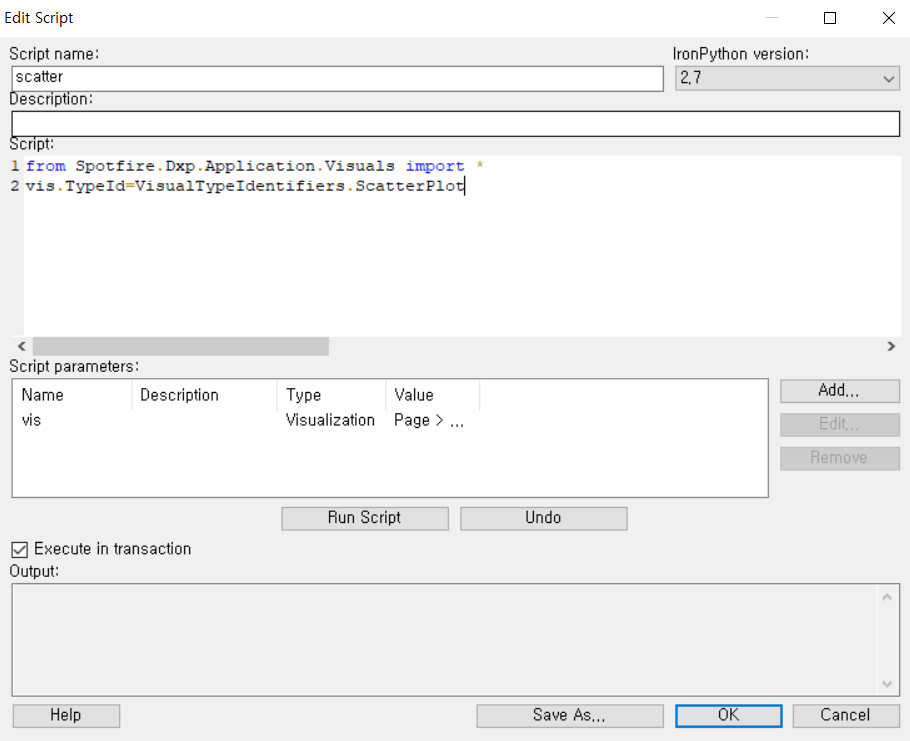
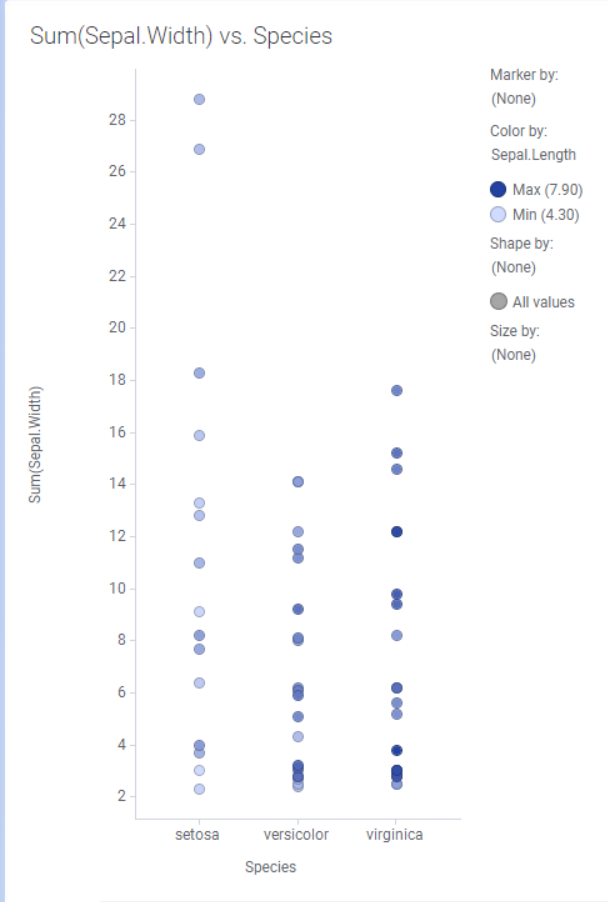
위와 같이 수정하고 run을 해주면 다음과 같이 바뀌어집니다.
728x90
728x90


댓글